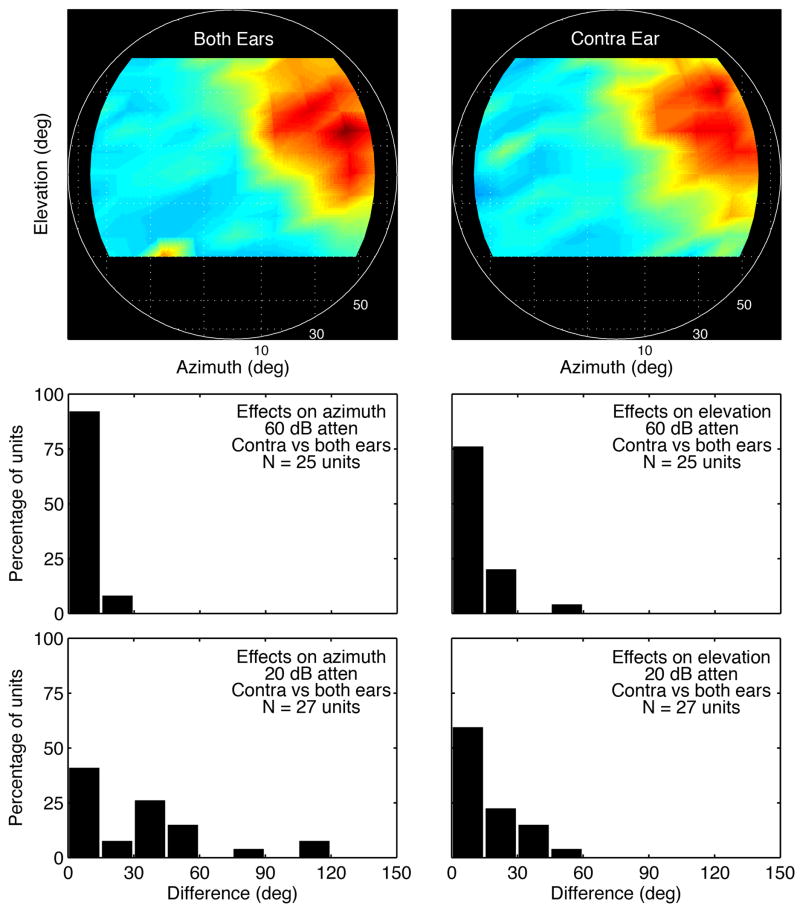
Figure 9.
Effects of presentation mode on spatial tuning. Surface plots (upper panels) show the directional rates of a type IV neuron (BF = 11.0 kHz) for binaural versus contralateral stimuli. Histograms (lower panels) describe the difference in the azimuth and elevation of maximum directional rates under binaural versus contralateral conditions.

