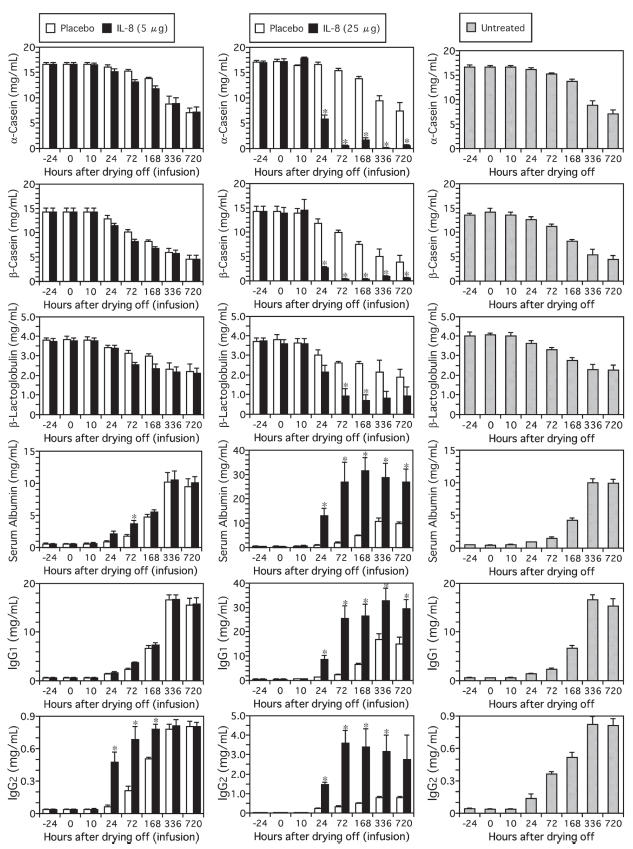
Figure 2.
Changes in concentrations of α-casein, β-casein, β-lactoglobulin, serum albumin, IgG1 and IgG2 in mammary secretions from cows infused with 5 μg (A) or 25 μg (B) of rbIL-8 at drying off. The data from rbIL-8- and saline-infused udders are shown using closed and open bars, respectively. The data from the untreated cows are shown using the shaded bars (C). An asterisk (*) indicates a significant difference from both the saline-infused mammary gland and the mammary gland of untreated cows at the same time point.

