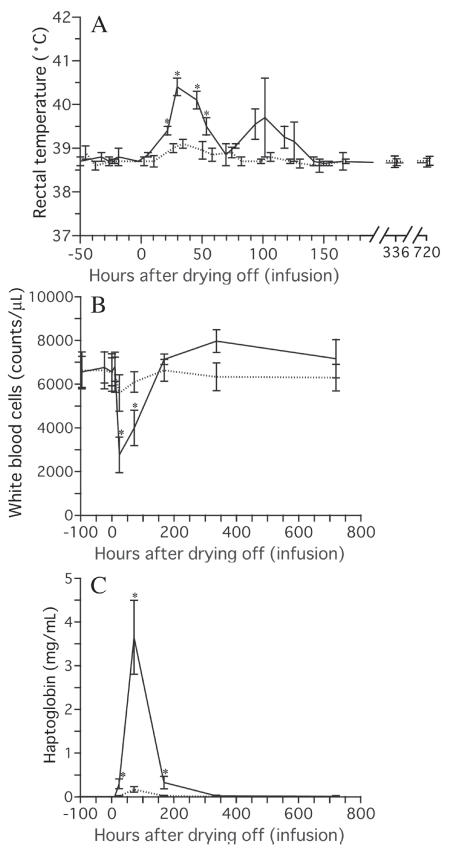
Figure 3.
Changes in rectal temperature (A), white blood cell count (B) and haptoglobin concentration in the serum (C) following intramammary infusion of rbIL-8. The data from the cows infused with 5 μg of rbIL-8 are shown using broken lines, and the data from the cows infused with 25 μg of rbIL-8 are shown using solid lines. An asterisk (*) indicates a significant difference from the data recorded before the infusion of rbIL-8.

