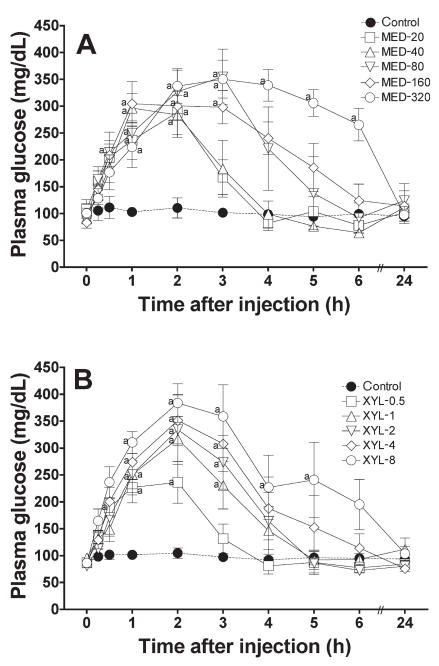
Figure 1.
Plasma glucose concentrations after the administration of various doses of A) medetomidine (MED; μg/kg) or B) xylazine (XYL; mg/kg) to cats. Each point and vertical bar represent the mean and standard error (n = 5); a — significantly different (P < 0.05) from the value at time 0 (before drug administration).

