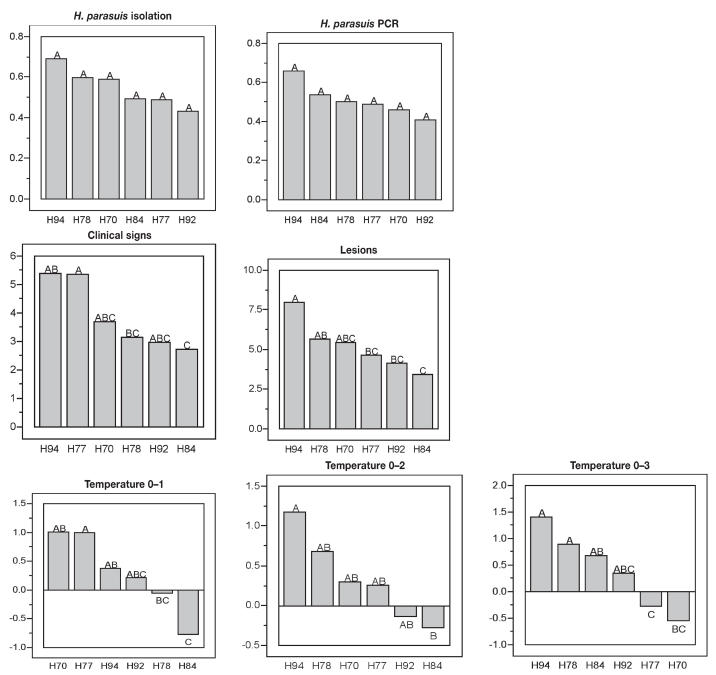
Figure 2.
Ranking for the susceptibility to H. parasuis for the offspring of 6 boars of similar genetic background. A 2-way ANOVA model was used with Sire and Test Day as fixed effects. Student’s t-test was used for multiple comparisons among least mean squares (LMS). The LMS of the score is shown for each trait measured (isolation, PCR) in the Y-axis. Sires, shown in the X-axis, with similar letter did not differ significantly at P < 0.05, in the X-axis.

