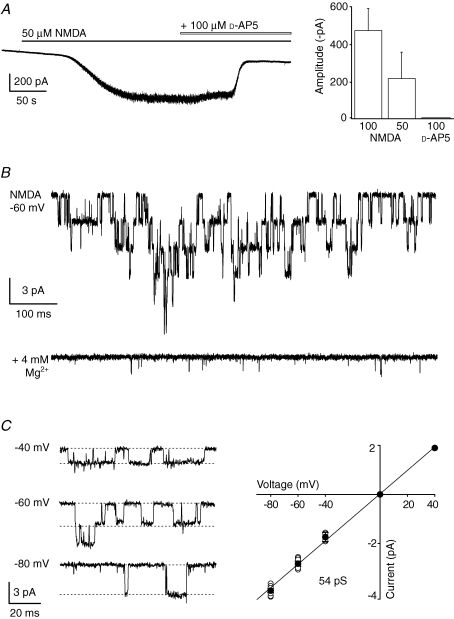
Figure 2.
Functional NMDARs in PCs from adult wild-type mice A, representative whole-cell response to bath applied NMDA (50 μm glycine, −60 mV) and its subsequent block by d-AP5. Right: the bar graph shows amplitudes of currents evoked by different concentrations of NMDA, and block by d-AP5 in pooled data from 7 experiments (concentrations in μm). B, superimposed single-channel currents recorded in the presence of 100 μm NMDA (50 μm glycine; −60 mV) in an outside-out patch from a P67 mouse. Lower trace shows block in the presence of Mg2+ (4 mm). C, NMDA-channel currents recorded at various membrane potentials in a patch from a P74 mouse (100 μm NMDA plus 50 μm glycine; dotted lines indicate the slope conductance for this patch). Right panel shows I–V plot of pooled data from 7 experiments (all mice older than P61; mean slope conductance 54 pS).

