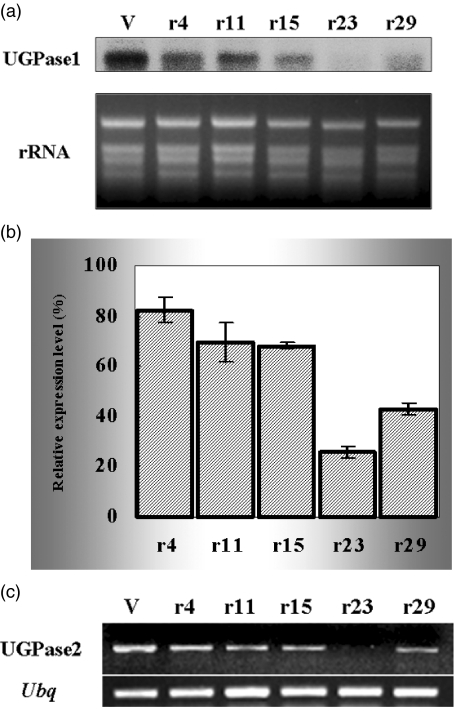
Figure 6.
- Northern blot analysis of UGPase1 gene expression. The upper panel shows the RNA gel blot probed with the NotI fragments of UGP1 i pGEMT containing the 473-bp gene-specific region of the UGPase1 gene. The lower panel shows ethidium bromide stained rRNA as a loading control.
- Quantitative RT-PCR analysis of UGPase1 gene expression. The expression value was normalized with a ubiquitin control, and the results represent the average values of duplicate experiments shown as relative expression levels compared with empty vector-transformed plants.
- Semi-quantitative RT-PCR analysis of the expression of the UGPase2 gene. Amplification of the ubiquitin gene was used as a control. V, empty vector-transformed plant; r4, r11, r15, r23 and r29: UGPase1-RNAi plants.

