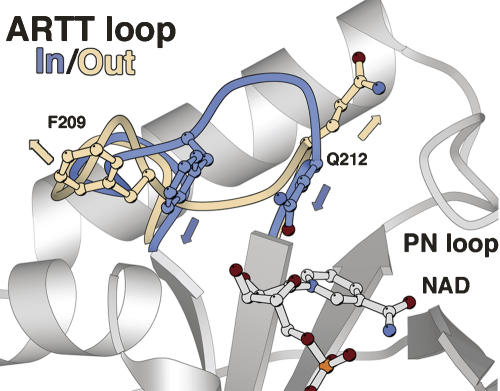
Figure 1.
The ARTT loop conformations. The “in” and “out” conformations of the ARTT loop are shown in blue and beige, respectively. The “in” conformation which is defined by Phe209 and Gln212 from the ARTT motif extended inside the NAD-binding site is shown in blue. The “out” conformation with both residues extended outside is shown in beige. The NAD is shown in ball-and-stick representation.

