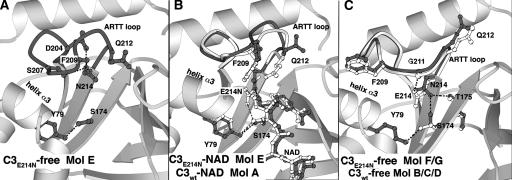
Figure 4.
The catalytic glutamate mutant (E214N) active site. The ARTT loop and residues from the NAD binding site are shown in gray. Hydrogen bonds are indicated by a dashed line (black). Orientation is conserved between the three panels. (A) C3-E214N-free structure (molE, 2C8E). (B) Comparison of the C3-E214N-NAD structure (molE, 2C8F) with the C3wt-NAD structure (molA, 1GZF; ball-and-sticks in white, and dash line in gray). (C) C3-E214N-free structure (molF/G, 2C8E).

