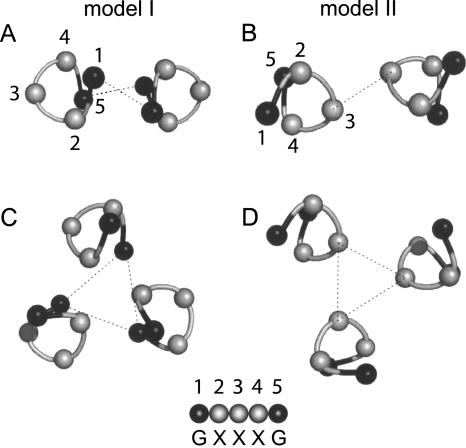
Figure 1.
Schematic representation of the two modes of interaction (I and II). Slices through the α-helical structure of the integrin TM model we predicted previously using a computational method (Lin et al. 2006). Only the α carbons are shown. (A) Homodimer model I; (B) homodimer model II; (C) homotrimer model I; (D) homotrimer model II. In model I, the interaction takes place mediated by residues 1 and 5 (black balls) of the GxxxG-like motif. In model II, the interaction is opposite, through residue 3. Dotted lines are shown only to guide the eye. A more detailed representation of these structures is shown in Lin et al. (2006).

