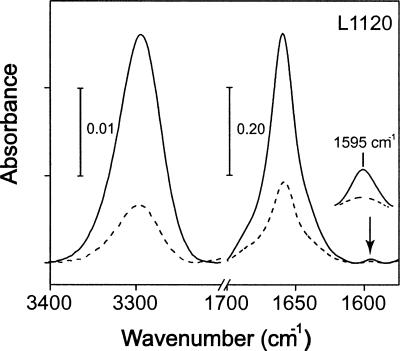
Figure 5.
Representative infrared spectra in the amide A and I regions. The spectrum shown corresponds to αM-TM (NSVGG) reconstituted in DMPC bilayers, collected at parallel (solid line) and perpendicular (broken line) polarization. The isotopically labeled residue (L1120) is indicated. The band corresponding to the 13C=18O label is indicated with an arrow, and displayed as an enlarged view.

