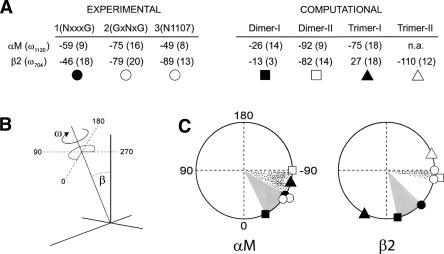
Figure 6.
Comparison between experimental (this study) and computationally predicted orientational parameters. (A) The residue used to calculate ω (see black dot in Fig. 2) using SSID is indicated in the first column. Experimental values of ω (and helix tilt, shown within parentheses) were obtained using pairs 1, 2, and 3 in Figure 2. Computationally predicted values (Lin et al. 2006) are shown for model I (dimer and trimer) and model II (dimer and trimer). The symbols below the table are used in the lower panel to represent the location of the labeled residue around the helix (ω). (B) Schematic representation of ω and helix tilt, β, in an α-helix. (C) Location of L1120 (for αM) and V704 (for β2), according to experimental (this study) or computational predictions (Lin et al. 2006). The shaded sector (gray or dotted) represents the angular distance between experimental and predicted value in each case.

