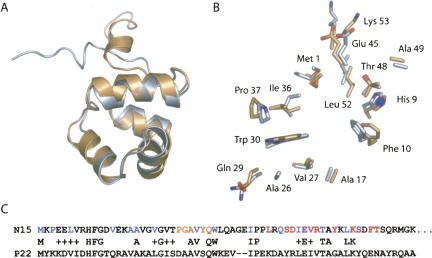
Figure 2.
Comparison of N15 Cro and P22 Cro. (A) Ribbon diagram representation of chain A of N15 Cro (gold) superimposed on a minimized average solution structure of P22 Cro derived from the NMR ensemble (1RZS). (B) Locations and conformations of identical side chains in the two proteins (same color-coding and approximate orientation as in part A). (C) Sequence alignment highlighting buried residues (<10% ASA) of N15 Cro (blue), residues in the dimer interface within 4 Å of the other chain (red), residues both buried and within 4 Å of the other chain (purple), and putative base-contacting residues in the recognition helix (orange). P22 Cro and N15 Cro have 32% sequence identity over 53 residues. Parts of this figure were prepared using PyMOL (DeLano Scientific).

