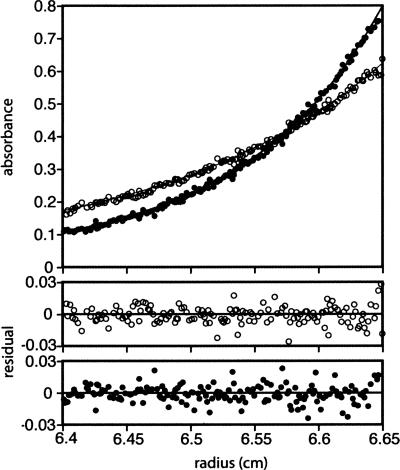
Figure 5.
Dimerization of N15 Cro characterized by sedimentation equilibrium. Two radial absorbance curves are shown for a loading concentration of 10 μM of N15 Cro and rotor speeds of 23,000 (open circles) and 30,000 rpm (filled circles), monitored at a wavelength of 235 nm. The curve fits shown are based on parameters from global monomer-dimer fitting of three concentrations and two rotor speeds. Residuals for each of the two curves shown are at the bottom of the figure.

