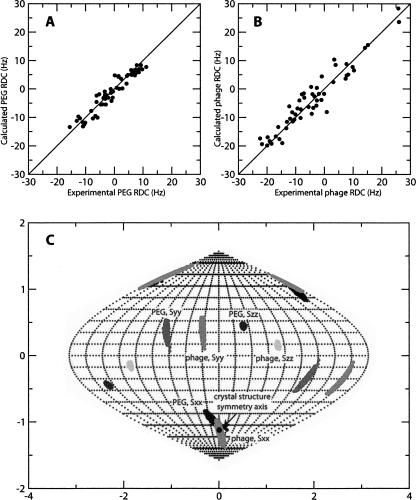
Figure 2.
(A) Correlation between experimental RDCs collected in a PEG alignment medium and the back-calculated RDCs using dimer model B from the X-ray structure. (B) Correlation between experimental RDCs collected in phage alignment medium and the back-calculated RDCs using dimer model B from the X-ray structure. (C) Sauson–Flamsteed projection of the orientation of the PEG and phage alignment tensor principal axes frames in the PDB coordinate. Each horizontal grid represents 20° and each vertical grid represents 10°. (Black dot) Orientation of the crystal structure symmetry axis.

