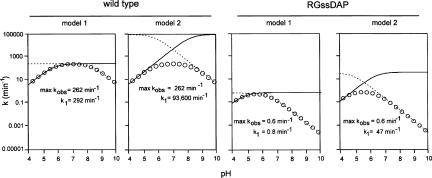
FIGURE 5.
Estimation of k 1, the intrinsic rate of the bond-breaking step. Simulations of each of the two kinetically ambiguous models of general acid–base catalysis for wild-type and RGssDAP using Equations 3 and 4 in Materials and Methods (Bevilacqua 2003). Circles represent simulated k obs values; dashed and dotted lines indicate the titration of the general acid or general base. Apparent pKa values are summarized in Table 1.

