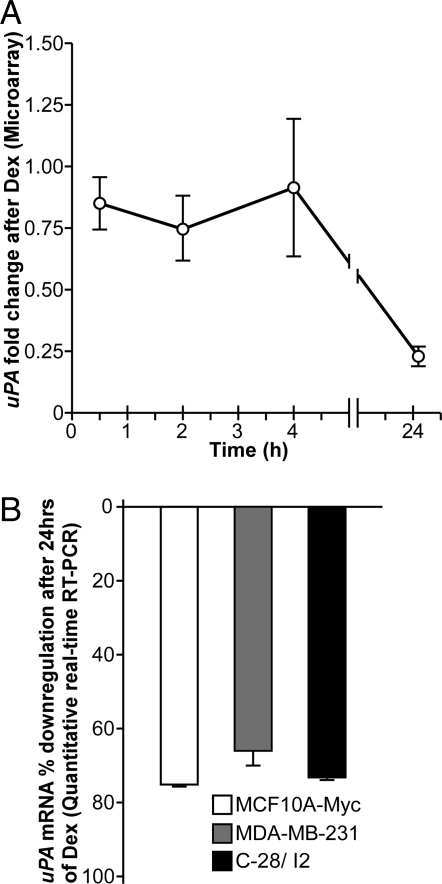
Figure 2.
Down-regulation of uPA mRNA in different cell lines. A, Microarray expression of uPA after Dex treatment in MCF10A-Myc cells. The fold change of gene expression is shown relative to vehicle after normalization, and data are reported as a mean ± se of three independent experiments. B, Quantitative real-time RT-PCR evaluation of uPA mRNA levels after 24 h Dex or vehicle treatment in MCF10A-Myc (white bars), MDA-MB-231 cells (gray bars), and C-28/I2 cells (black bars). The fold change of gene expression is shown relative to vehicle after normalization to GAPDH, and data are reported as a mean ± se of triplicate experiments. uPA mRNA was significantly down-regulated compared with vehicle in all three cell lines with a P < 0.05 using a two-tailed unpaired Student’s t test.

