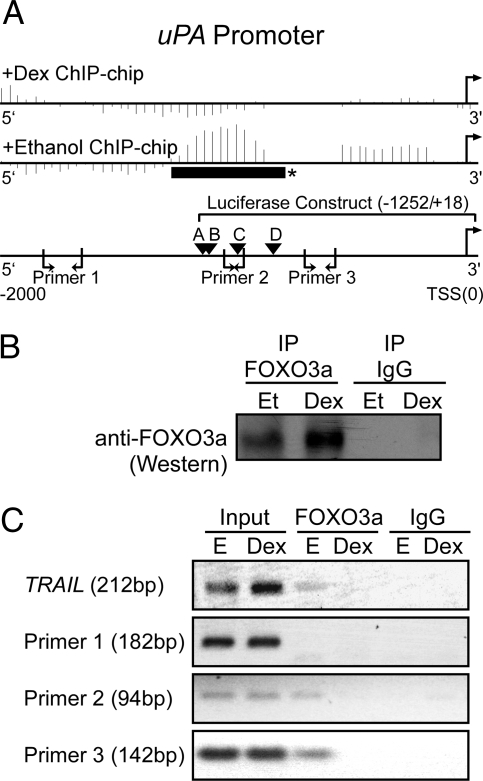
Figure 3.
FOXO3a binding to the uPA promoter. A, Schematic of the uPA promoter (−2000/+50) showing the data from the FOXO3a ChIP-chip experiment for uPA, the location of putative FOXO3a core binding [(A/G)(C/T)AAA(C/T)A] sites (labeled A–D), the three uPA primers used in the ChIP assay, and the region of the promoter used in a luciferase assay (Fig. 6). For the ChIP-chip data, the vertical lines represent a score calculated for a window around each probe by the MAT software. Ethanol and Dex-treated samples are shown after normalization with their respective input samples. *, Represents a region (solid horizontal black bar) that shows a significant ChIP-chip binding region as determined using MAT (P < 10−3; uPA, 2.74 × 10⁻⁴). B, Immunoprecipitation (IP)/Western blot showing anti-FOXO3a and control IgG immunoprecipitates from MCF10A-Myc cells starved for 72 h and treated with Dex (10−6 m) or vehicle [ethanol (Et)] for 24 h. C, PCR products from input DNA, chromatin immunoprecipitated anti-FOXO3a, and control IgG using TRAIL control primers and the three pairs of uPA primers. The experiment was performed three independent times with similar results.

