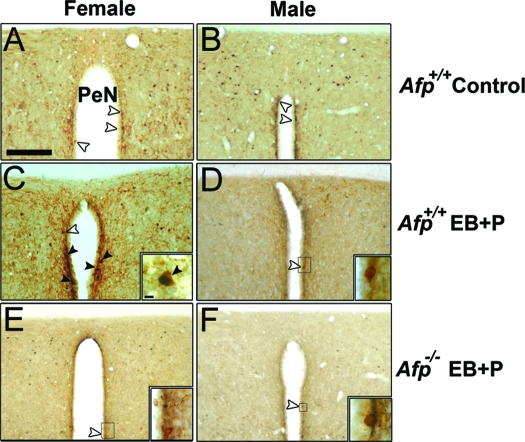
Figure 3.
Analysis of FOS activation in Kisspeptin-10 neurons present in the Pe. A, A detailed photomicrograph of the absence of FOS activation in Kisspeptin-10 neurons of an untreated Afp+/+ female. B, A detailed photomicrograph of the absence of FOS activation in the Kisspeptin-10 neurons of an untreated Afp+/+ male. C, A detailed photomicrograph of FOS activation in the Kisspeptin-10 neurons of a treated Afp+/+ female. A photomicrograph of a double-labeled neuron is represented in the right-bottom corner of this panel. D, A detailed photomicrograph of the absence of FOS activation in Kisspeptin-10 neurons of a treated Afp+/+ male. A photomicrograph of an unlabeled neuron is represented in the right-bottom corner of this panel. E, A detailed photomicrograph of the absence of FOS activation in Kisspeptin-10 neurons of a treated Afp−/− female. A photomicrograph of an unlabeled neuron is represented in the right-bottom corner of this panel. F, A detailed photomicrograph of the absence of FOS activation in Kisspeptin-10 neurons of a treated Afp−/− male. A photomicrograph of an unlabeled neuron is represented in the right-bottom corner of this panel. In all pictures Kisspeptin-10 immunoreactive neurons are stained with DAB (brown precipitate) and FOS with DAB plus nickel (black precipitate). Empty arrowheads show nonactivated FOS/Kisspeptin-10 neurons. Black arrowheads show activated FOS/Kisspeptin-10 expressing neurons. Scale bar in A represents 200 μm, and it is applicable to all photomicrographs. The detailed photomicrograph of the selected area in the right corner represents 25 μm except in E, where it represents 50 μm.

