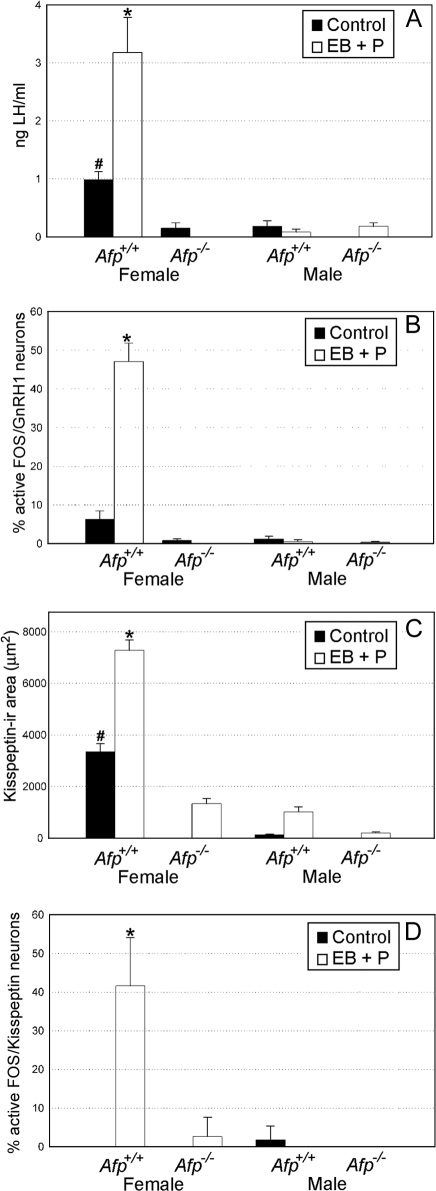
Figure 4.
Quantitative analysis of the ability to show a steroid-induced preovulatory LH surge. A, Plasma LH levels in ng/ml (mean ± sem). B, The percentage of FOS-activated GnRH1 cells (mean ± sem) in the AVPe. C, The area occupied by Kisspeptin-10 immunoreactive fibers (mean ± sem) present in the ADP nucleus. D, The percentage of FOS-activated Kisspeptin-10 cells (mean ± sem) in the Pe. All experiments were conducted in Afp−/− and Afp+/+ mice of both sexes. Control treatments consisted of a sc SILASTIC brand capsule containing crystalline 17β-E2 (1 wk before hormonal induction). EB plus P treatments consisted of a sc SILASTIC brand capsule containing crystalline 17β-E2 and sequential treatment with EB (d 1) and P (d 2). *, P < 0.05 compared with all other groups. #, P < 0.05 compared with all other groups.

