Figure 1.
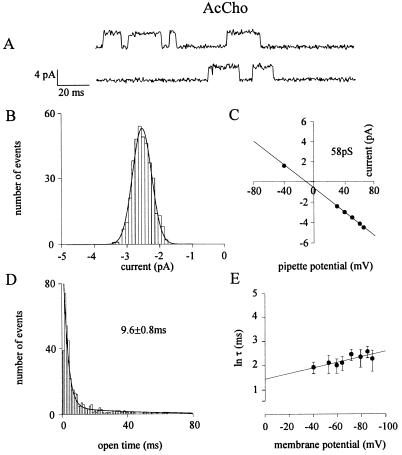
Properties of L247T α7 nAcChoR-channels activated by the natural transmitter AcCho. All panels refer to cell-attached patches of oocytes injected with chicken L247T α7 subunit cDNA. (A) Examples of single-channel currents at −70 mV EMP. Inward currents are represented by upward deflections. (B) Distribution of single-channel amplitudes at − 53 mV EMP, with 200 nM ACh in the patch pipette, in the same patch. Histogram is best fitted by a single Gaussian curve, with a mean of 2.42 ± 0.02 pA (n = 379). (C) Mean channel current amplitudes at different potentials plotted vs. pipette potential, and fitted by linear regression (solid line), yielding the slope conductance indicated. (D) Histogram of open durations fitted by the sum of two exponential functions, with τ1 = 2.69 ± 0.01 (67%), τ2 = 34.84 ± 0.01 (32%), and τop as indicated. Same patch as A–C. (E) Voltage-dependence of mean open time obtained from six patches (six cells, two donors). Averaged values of τop plotted vs. membrane potential. Error bars indicate SEM. The solid lines represent the least-squares fits of τop with the equation τop = τ0 exp(mV), where m indicates the slope of the linear fit. Note the increase of τop with membrane hyperpolarization.

