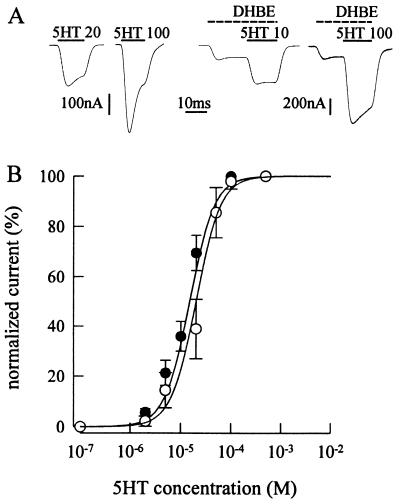
Figure 3.
Membrane currents from voltage-clamped oocytes injected with L247T α7 subunit cDNA. (A) Records of 5HT currents (I5HT) in a control (Left) and in an oocyte (Right) exposed to 0.1 μM DHβE before applying 5HT at the indicated doses (in μM). Note the current elicited by DHβE, before the 5HT current. Inward currents are represented by downward deflections. The timings of drug applications are indicated by bars above the current traces. (B) 5HT dose-I5HT relationship fitted to Eq. 1 (see Materials and Methods), in the presence of 0.1 μM DHβE (•) and in standard solution (○). Oocytes were held at −50 mV and exposed to DHβE for 20 s before eliciting I5HT in the presence of the drug. The current elicited by DHβE peaked to 90 (± 20) nA. The peak I5HT was normalized to that evoked by 0.5 mM 5HT (I5HT peak amplitude in standard solution: −1,490 ± 770 μA; mean ± SD). Each point represents the mean ± SD (n = 6; two donors for •; n = 8, three donors for ○). Control: EC50 = 20 μM; nH = 1.8. In the presence of DHβE: EC50 = 15 μM; nH = 1.8. Same values were obtained in oocytes voltage-clamped at −110 mV.

