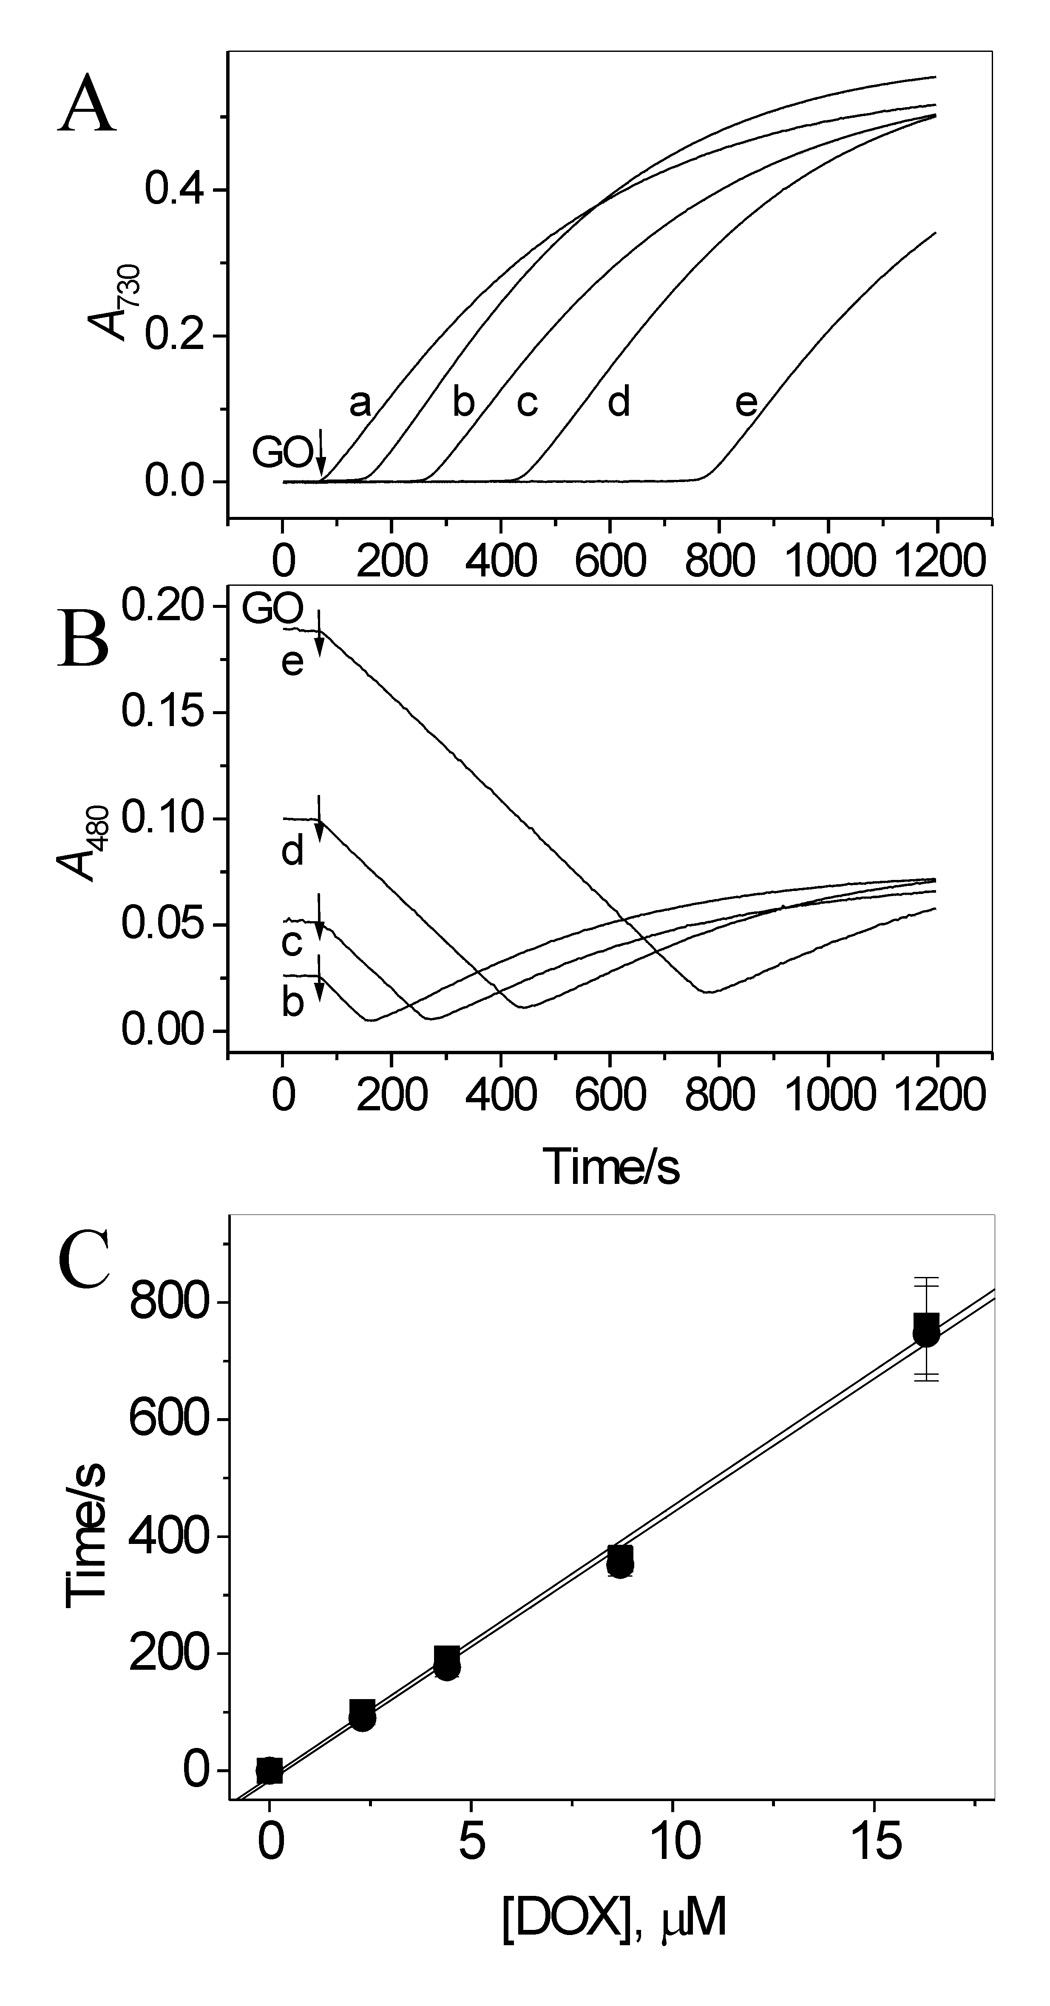
Figure 2.

Effect of DOX on oxidation of ABTS by LPO and H2O2 (generated by Gl/GO) in aerated pH 7.0 buffer. (A) Time course of accumulation of ABTS•+ measured at 730 nm in the absence (trace a) and presence of 2.3, 4.4, 8.7 and 16.3 µM DOX, traces b – e, respectively. (B) Simultaneously measured changes in absorbance at 480 nm indicate oxidation of DOX. Note that oxidation of DOX starts immediately upon addition of GO at all [DOX] used. The differences in initial absorbance at 480 nm (lines b – e) are due to different contents of DOX in those samples. The increase in absorbance at 480 nm after reaching a minimum, is due to accumulation of the ABTS•+ radical, which has a residual absorption at this wavelength. (C) Plots of lag time (●) preceding the appearance of ABTS•+ and Δt, the time at which A480 reached minimum (■), versus [DOX], based on data in panels A and B. [ABTS] = 50 µM, [Gl] = 1 mM, [GO] = 0.05 unit/mL, [LPO] = 17 nM. N = 3.
