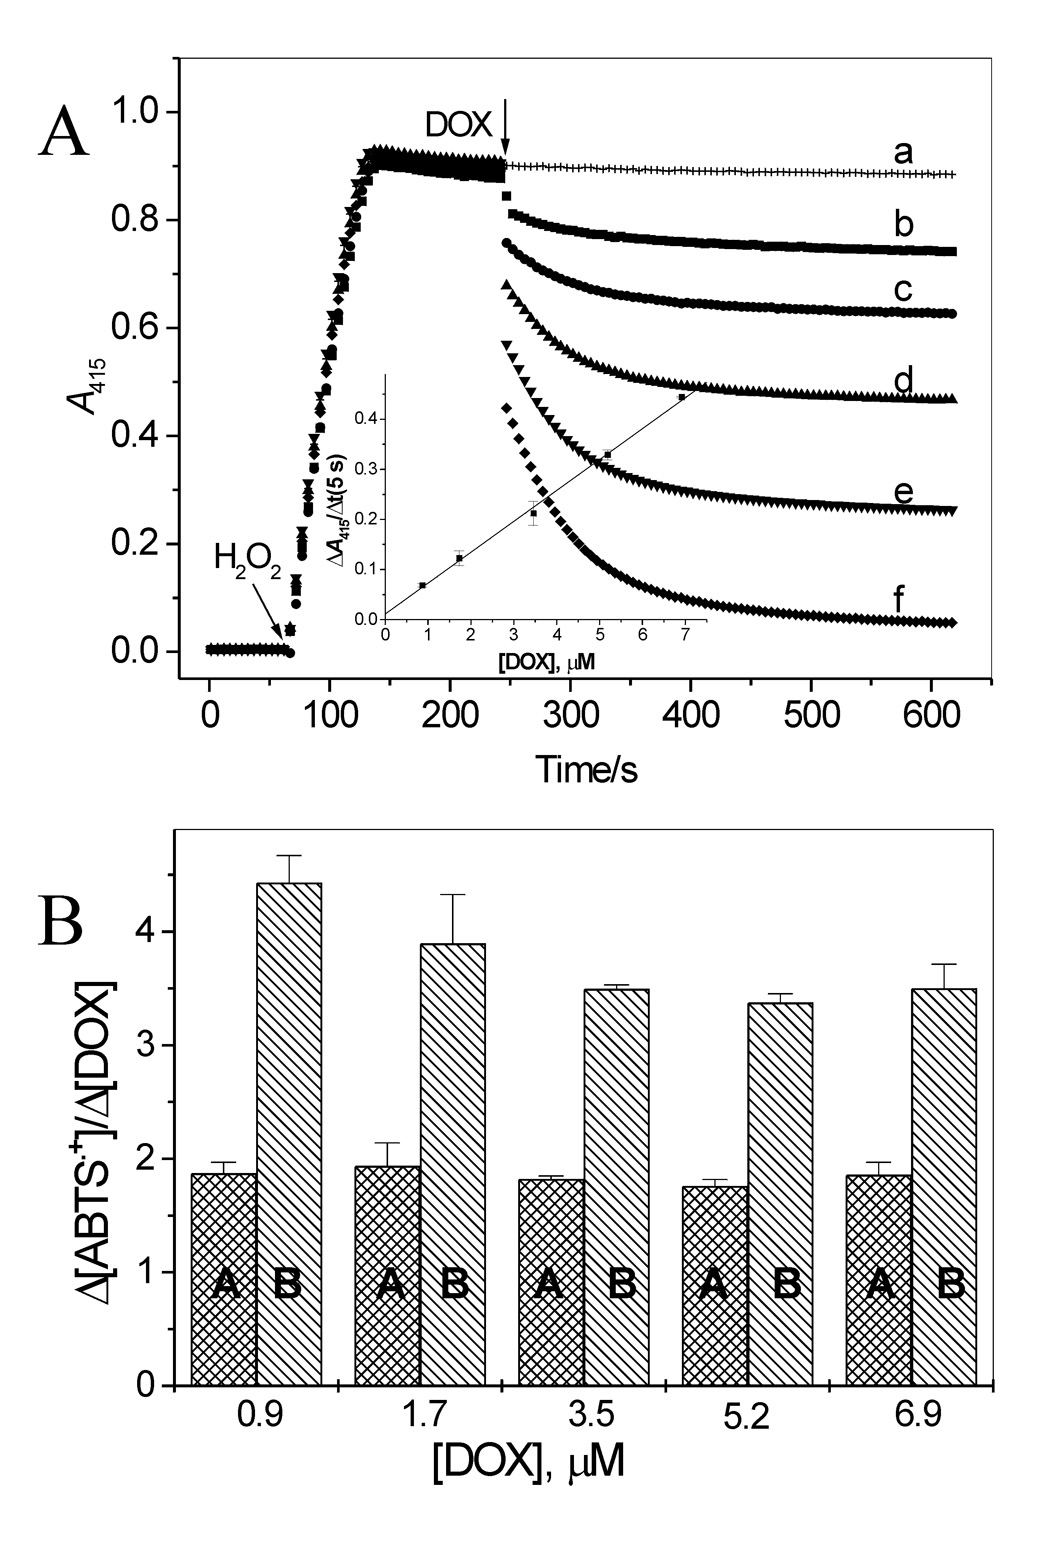
Figure 3.

Interaction of ABTS•+ with DOX. (A) Time course of ABTS reduction by 0.9, 1.7, 3.5, 5.2, and 6.9 µM DOX. ABTS•+ was generated by incubation of ABTS (100 µM) with LPO (26 nM) and H2O2 (14 µM) and when the absorbance at 415 nm stabilized, an aliquot of DOX stock solution was added. Inset: Loss of ABTS•+ measured as ΔA415 during first 5 s of the reaction versus [DOX]. (B) Stoichiometry of the reaction of ABTS•+ with DOX during the fast (first 5 s) and slow phases of the reaction (columns A and B, respectively) versus [DOX].
