Figure 2.

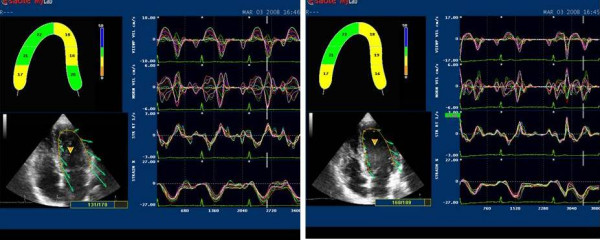
2D LPSS evaluation at rest (left side) and after HG (right side). Strain values show a slight but not significant increase from basal to apical segments in both situations.

2D LPSS evaluation at rest (left side) and after HG (right side). Strain values show a slight but not significant increase from basal to apical segments in both situations.