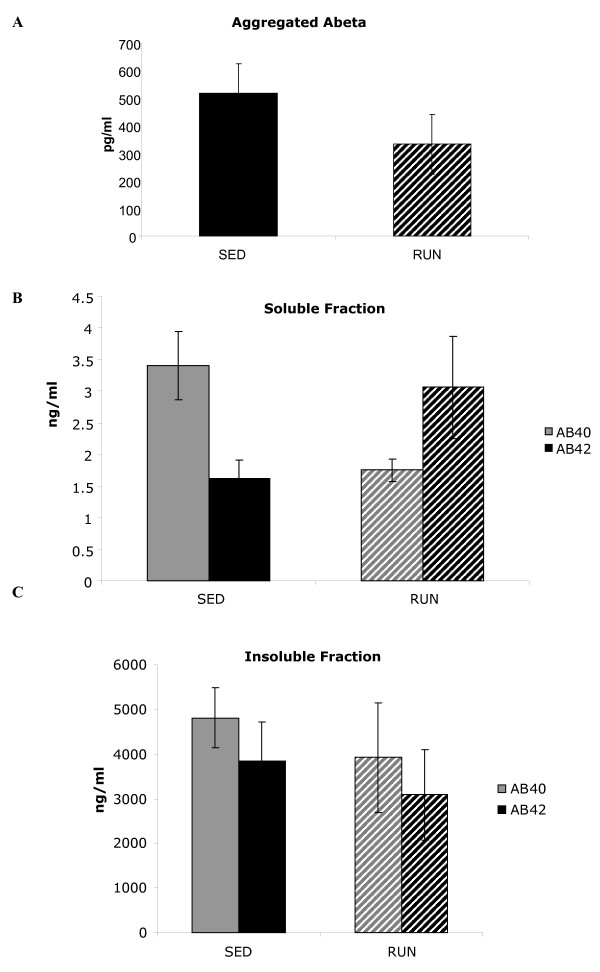
Figure 6.
Aβ analysis by multiplex and ELISA. Aggregated Aβ levels are not significantly lower in hippocampus of TGRUN compared to TGSED, though a 35% decrease is observed in means. (A) Aβ40 but not Aβ42 is significantly lower in soluble fractions from cortex of TGRUN and TGSED (p = 0.01)(B). There are no significant differences in insoluble fractions (C).

