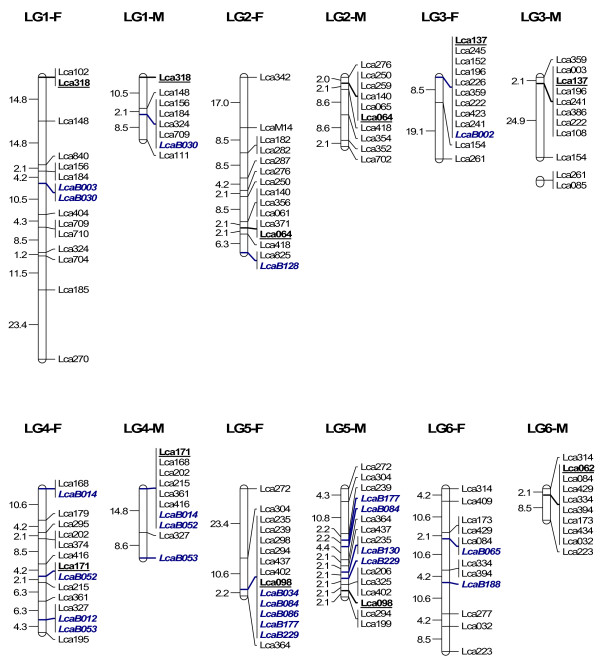
Figure 4.
A microsatellite linkage map of L. calcarifer anchored by 86 BAC clones-LG 1–6. F: linkage map for female. M: linkage map for male. Markers underlined represent microsatellites selected from each LG for screening the BAC library. Markers in italic (initiated with LcaB) represent microsatellites isolated from BAC clones and newly mapped to the map.

