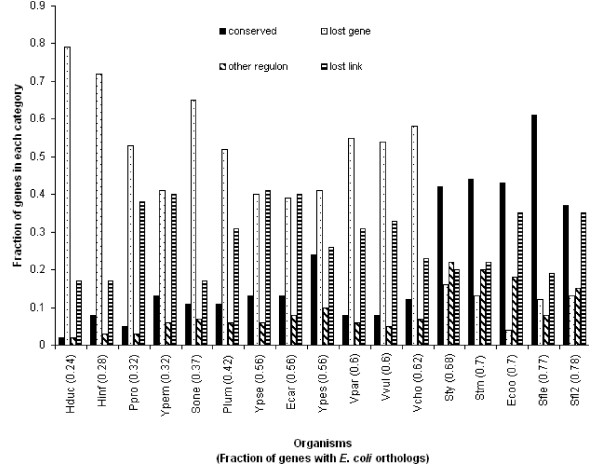
Figure 2.
Distribution of orthologous regulatory interactions in 17 organisms in the four conservation categories. The organisms in the abscissa are ordered according to the fraction of their genes that have orthologs in E. coli. From left to right, solid black columns: conserved category; dotted columns: lost gene category; diagonal stripes: other regulon category; horizontal stripes: lost link category.

