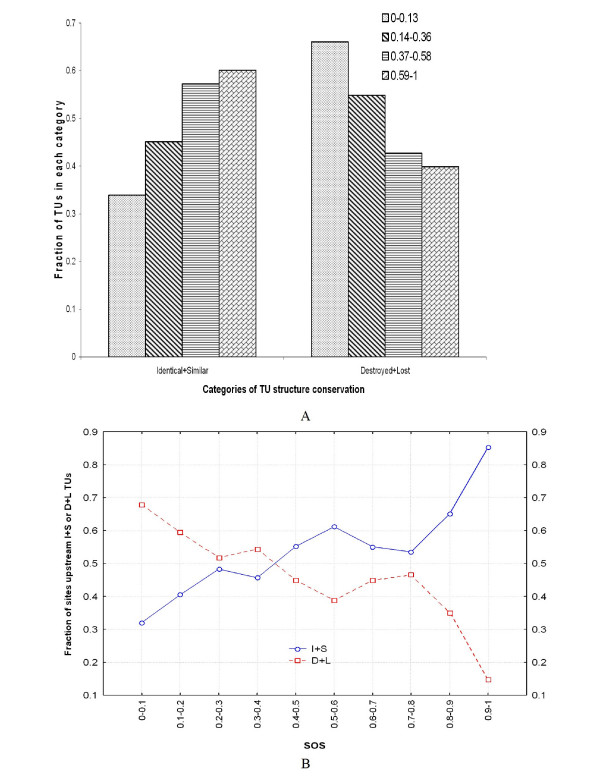
Figure 5.
Relationship between the conservation of a site and the conservation of the TU it regulates. A) Distribution of TUs in eight categories according to the conservation of their structure (with respect to their E. coli orthologs) and the conservation of regulatory sites upstream them. B) Fraction of sites that fall upstream TUs with either Identical or Similar or Destroyed or Lost structures. Sites are grouped in categories of increasing SOS values.

