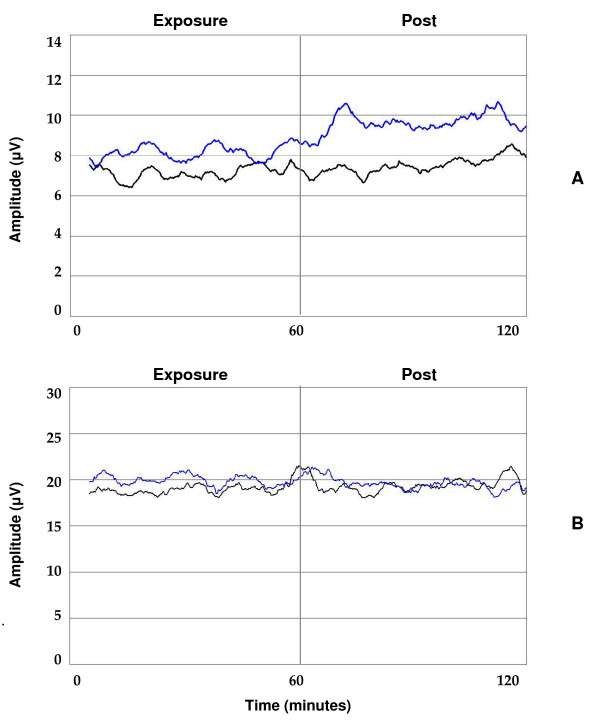
Figure 3.
Absolute beta2 amplitudes (A) and theta amplitudes (B) at the left frontal cortex (F3). Changes are represented as a function of time in a superposed epoch analysis graph for all subjects combined. Absolute power per frequency band is visualized for diesel (blue line) and sham condition (black line), combining the one hour exposure condition and subsequent post condition in one graph. Both lines represent a 5 minute moving average of the original signal. Beta2 (A) but not theta-amplitudes (B) are elevated during diesel exposure compared to sham exposure.

