
Figure 5.
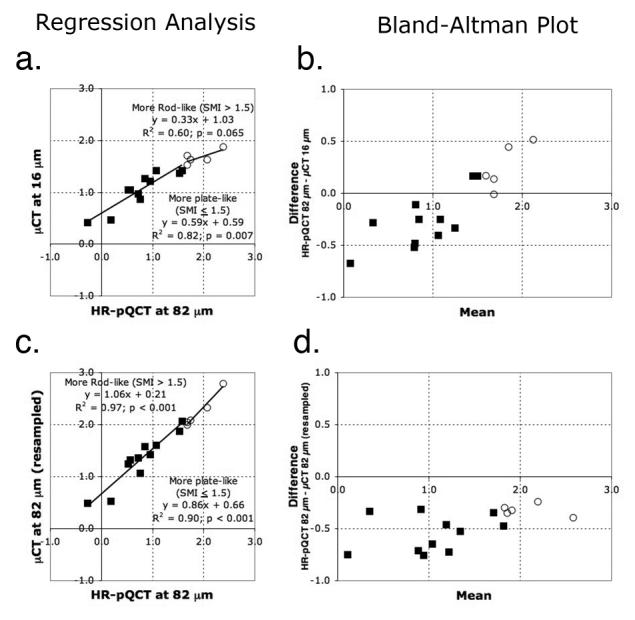
The linear regression analyses and the Bland-Altman plots on the SMI for trabecular bone core of human distal tibia calculated from two sets of images obtained differently: (a-b) The HR-pQCT images and the μCT images at reference resolution (16 μm) and (c-d) the resampled μCT images and the HR-pQCT images both at 82 μm. The measurements are grouped by the structure type at threshold SMI = 1.5. The predominantly plate-like structure (SMI ≤ 1.5) is represented by a filled square and the predominantly rod-like structure (SMI > 1.5) by an open circle. The linear regression analysis determines the correlations and the Bland-Altman plots qualitatively compare the measurements obtained from two datasets.