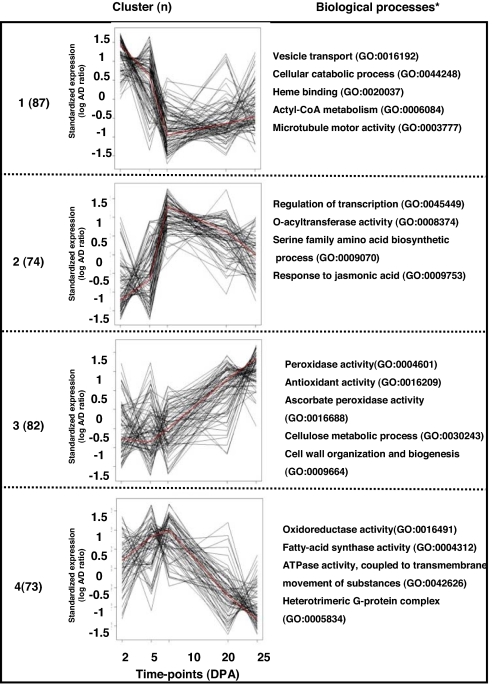
Fig. 3.
Cluster analysis of differentially biased genes during fiber development. The log(A/D) ratios between five time points during fiber development were standardized and clustered, as described (21). Time points studied are: 2 DPA, fiber initiation; 5 DPA, early elongation; 10 DPA, rapid elongation; 20 DPA, transition for secondary cell biosynthesis; 25 DPA, halt in elongation, only secondary cell biosynthesis. Shown are the number of genes and the significant biological processes (P < 0.05) for each cluster. Red lines indicate the mean values for each time point. The data presented here are for the AD1 domesticated form.

