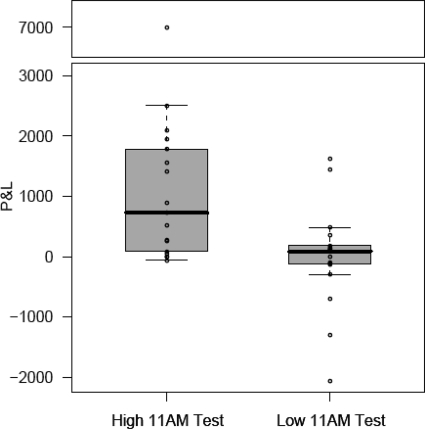
Fig. 2.
Testosterone and economic return. Boxplot showing average profit and loss (P&L, y axis, £ sterling) made between 11:00 a.m. and 4:00 p.m. on days when subjects had 11:00 a.m. testosterone above (High) and below (Low) their median during the study. Individual data points are shown. Fourteen out of 17 subjects had higher P&L on high testosterone days than on low; the remaining subjects had negligible differences.

