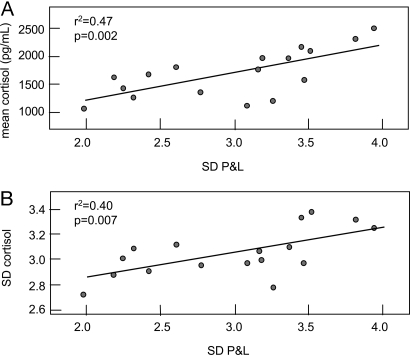
Fig. 3.
Cortisol and the variance of economic return. (A) Plot of mean cortisol (pg/ml) during the study for each trader correlated against the standard deviation of his profit and loss (P&L, logs). (B) Standard deviation of each trader's cortisol correlated against the standard deviation of his P&L (logs).

