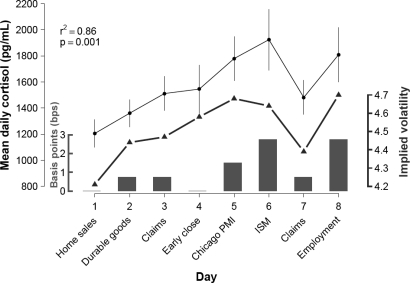
Fig. 4.
Group cortisol plotted against implied volatility of German Bunds. Implied volatility in most bond markets follows the calendar of U.S. economic statistics, rising during the week of Chicago Purchasing Managers Index (PMI), peaking on or just before the Employment Report, and dropping after the information contained in these numbers has reduced uncertainty over the state of the economy. The upper line is the daily cortisol level averaged from the group of traders (left axis, pg/ml; mean ± SEM, n = 11). The lower line is the implied volatility from German Bund (bond future) options with ≈1 month to expiration [right axis; Annualized standard deviation of the natural logs of daily price returns. Friday options (days 4 and 8) repriced to Sunday to eliminate the weekend effect. Bloomberg data]. Shaded bars display the importance of each economic release. The bars represent regression-derived day weights, i.e., the extra variance in Bund yields expected on that day due to the release of the U.S. economic statistic [lower left axis; basis points in yield change (12)]. The bars are for illustrative purposes only and do not enter into the statistical analysis. Implied volatility on day 5 was higher than expected, given the relative importance of the Chicago PMI, because the German market was surprised by the result of the French referendum.

