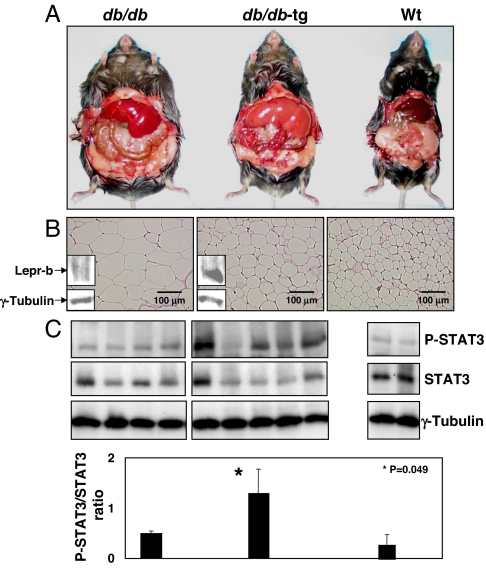
Fig. 1.
Comparison of 10-week-old db/db, db/db-tg, and normal mice. (A) Exposure of s.c. and visceral fat showing less fat in the db/db-tg mouse. Appearance of both db/db and db/db-tg livers suggests steatosis, which is more marked in the latter. (B) Sections of epididymal fat of db/db, db/db-tg, and WT mice, showing reduced size of db/db-tg adipocytes compared with db/db despite identical food intake (Table 2). Immunoblot for C terminus of mouse Lepr-b is positive in db/db-tg fat but not in db/db fat. (C Upper) Adipose tissue phospho-STAT3, an index of leptin action, in db/db, db/db-tg, and normal mice. (Lower) Bars indicate the mean ± SEM of phospho-STAT3/STAT3 ratios.

