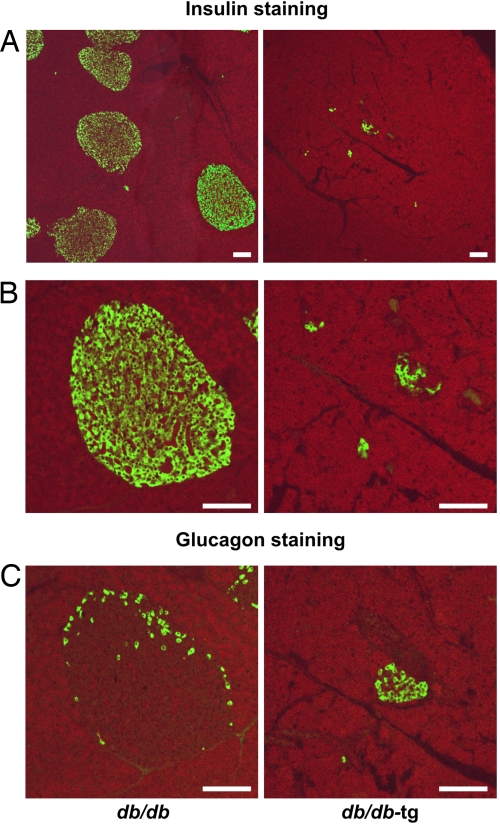
Fig. 3.
Immunofluorescent staining for insulin and glucagon of pancreas. (A) Low magnification view of pancreatic tissue showing a large number of islets in db/db mice (Left) and a fewer number of small insulin-positive areas in db/db-tg mice (Right). (B) Higher magnification of the cells in A. (C) The normal topography of glucagon-containing α cells in db/db mice (Left) contrasts with disrupted cells in db/db-tg mice (Right). (Scale bars: 100 μm.)

