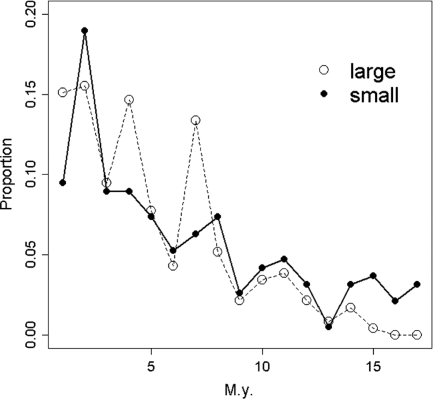
Fig. 1.
Histogram of durations of extinct small and large mammal genera. This histogram represents the full dataset (All); for subsets, see Fig. S1. Proportions are calculated for small (●) and large (○) mammals separately. One-million-year bins are plotted.

