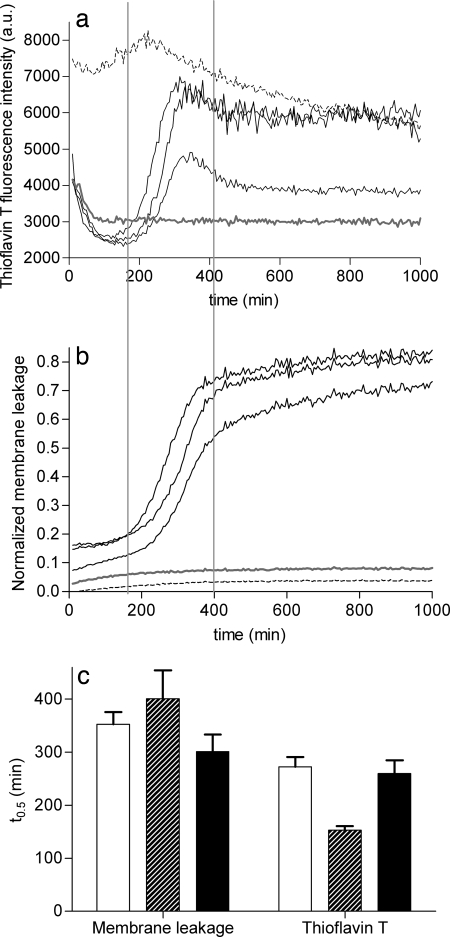
Fig. 1.
Comparison of the kinetics of hIAPP fibril growth and hIAPP-induced membrane leakage. (a and b) ThT fluorescence (a) and membrane leakage (b) were measured independently after the addition of hIAPP at a final concentration of 5 μM to DOPC/DOPS 7:3 LUVs (43 μM lipids) at time t = 0. The three solid black lines represent three hIAPP samples measured at the same time, in three adjacent wells on the same microtiter plate, with the same stock solutions. Representative traces are shown for mIAPP (gray lines) and preformed hIAPP fibrils (dashed lines). The two vertical lines are shown to facilitate comparison of the kinetic traces in a and b. (c) The average midpoints (t0.5) of the sigmoidal transitions for both ThT fluorescence and membrane leakage were obtained by fitting the curves to a standard sigmoidal function (see Experimental Procedures) and are shown for three independent experiments, each performed in triplicate, on different days, with different hIAPP stock solutions. The black bars correspond to the two experiments shown in a and b. The error bars indicate the standard deviation.

