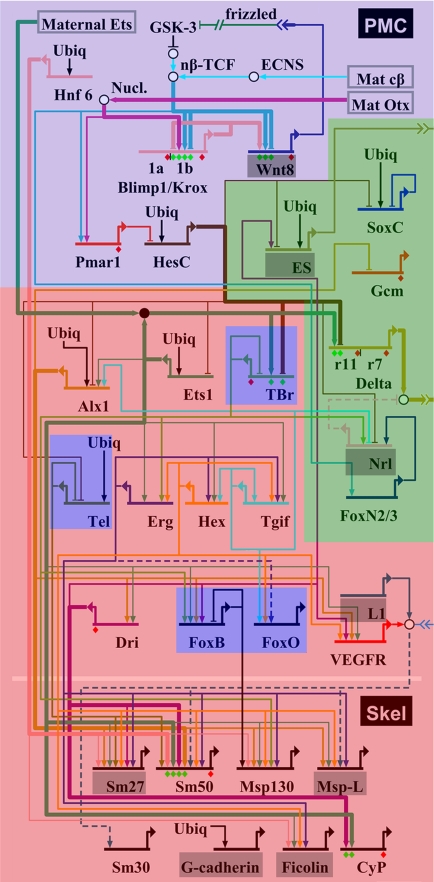
Fig. 3.
Map of gene expression data on micromere GRN. Genes expressed in juvenile skeletogenic centers and micromere lineage are shown over the red background. Genes used only in micromere lineage (<24–30 h) are shown over violet and green backgrounds. Green denotes genes used in micromere-specific signaling functions. The violet territory at the top denotes the portion of the GRN that executes the initial micromere specification function (see text); the four additional blue genes are individual cooptions, as discussed. Several genes not studied here are denoted over gray backgrounds.

