Fig. 1.
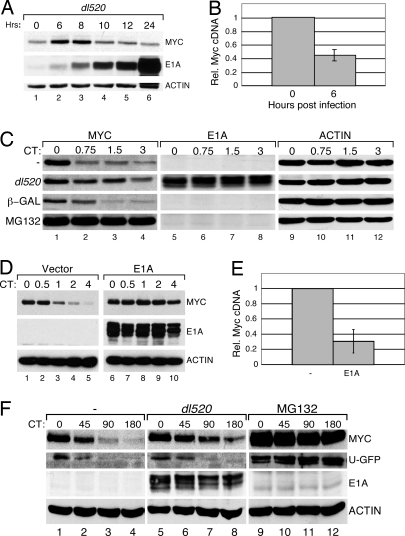
Adenovirus E1A stabilizes Myc. (A) U2OS cells were infected with adenovirus dl520 and harvested at the indicated time points. Levels of Myc, E1A, and actin were determined by WB. (B) U2OS cells were infected with adenovirus, as in A, and RNA was harvested. Levels of c-Myc cDNAs were analyzed by quantitative PCR and normalized to those of an actin control. (C) U2OS cells were either infected with dl520 or a control virus expressing β-gal, mock-infected, or treated with the proteasome inhibitor, MG132, and incubated for 6 h. CHX was added to inhibit protein synthesis, and protein samples were taken at the indicated times (CT; hours). WB analysis shows the levels of Myc, E1A, and actin. (D) U2OS cells were transduced with a retroviral expression construct encoding WT 12S E1A (pLPC E1A). CHX chase, followed by WB, was used to analyze Myc turnover in E1A expressing cells and control (vector) cells. (E) RNA was isolated from cells in D, and levels of c-Myc cDNAs relative to actin, determined by quantitative PCR. (F) U2OS cells were transiently transfected with a plasmid encoding unstable GFP (U-GFP) and incubated for ≈20 h. These cells were then either infected with dl520, mock-infected, or treated with MG132 and incubated for 6 h. CHX chase was used to analyze the levels of GFP, Myc, E1A, and actin.

