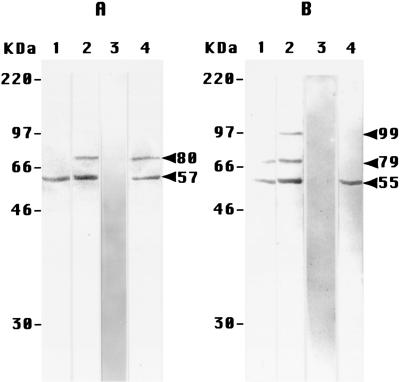
Figure 1.
Immunoblotting experiments on extracts of DAMI cells with the anti-peptide antibodies to PS-1 (A) and PS-2 (B). The apparent MA values on the left of each panel were obtained from Rainbow (Amersham) MA standards. (A) Lanes: 1, the in vitro translation product of PS-1 mRNA, showing only the single band of 57 kDa (arrow, at right of A); 2, PS-1 transfected cells, showing the same 57-kDa band and one additional band at 80 kDa; 3, PS-1 transfected cells (lane 2), immunoblotted in the presence of an excess of the specific soluble PS-1–MAP oligopeptide complex; 4, untransfected cells. (B) Lanes: 1, the in vitro translation product of PS-2 mRNA, showing a major band at 55 kDa, and another band at 79 kDa; 2, PS-2 transfected cells, showing the same two bands in lane 1, plus an additional minor band at 99 kDa; 3, PS-2 transfected cells (lane 2), immunoblotted in the presence of an excess of the soluble specific PS-2 oligopeptide–KLH conjugate; 4, untransfected cells, showing only the one band at 55 kDa.

