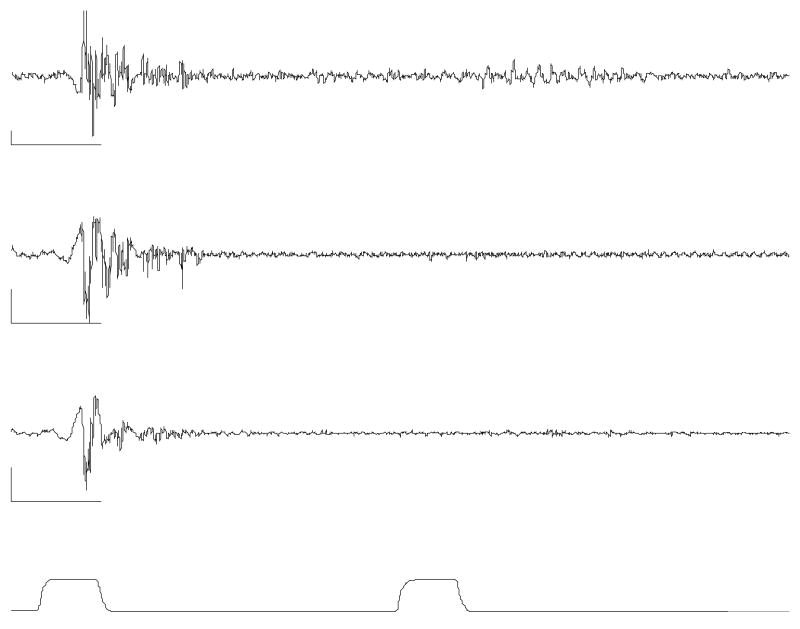
Figure 1.
This example illustrates the conditioning effect at an interpulse-interval of 500 ms. The top two traces are filtered recordings from the ipsilateral TAs and the third trace is from the contralateral TA. The bottom trace is the airpuff stimulus pressure. The calibration bars indicate 100 ms in time and 100 μV in EMG amplitude. The traces reveal that the response to the second stimulus is diminished or eliminated on both sides by the conditioning effect.

