
Fig. 3.
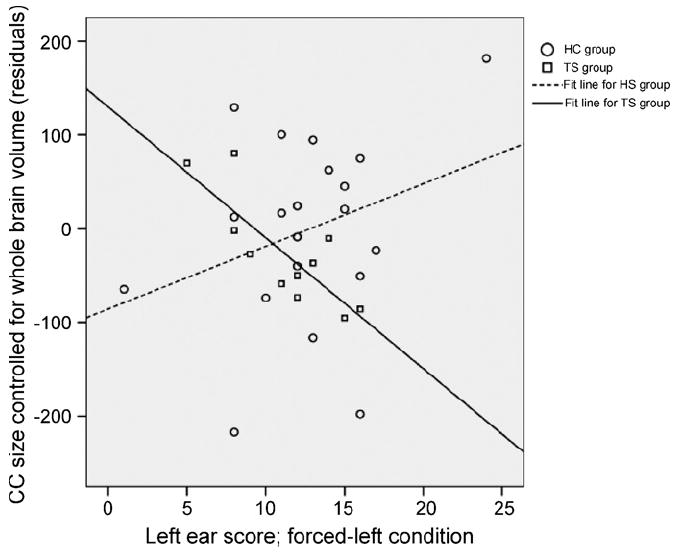
Residuals for left ear performance and CC size (controlled for whole brain volume), showing separate fit lines for the TS only and the HC group.
Official websites use .gov
A
.gov website belongs to an official
government organization in the United States.
Secure .gov websites use HTTPS
A lock (
) or https:// means you've safely
connected to the .gov website. Share sensitive
information only on official, secure websites.
Residuals for left ear performance and CC size (controlled for whole brain volume), showing separate fit lines for the TS only and the HC group.