
Figure 2.
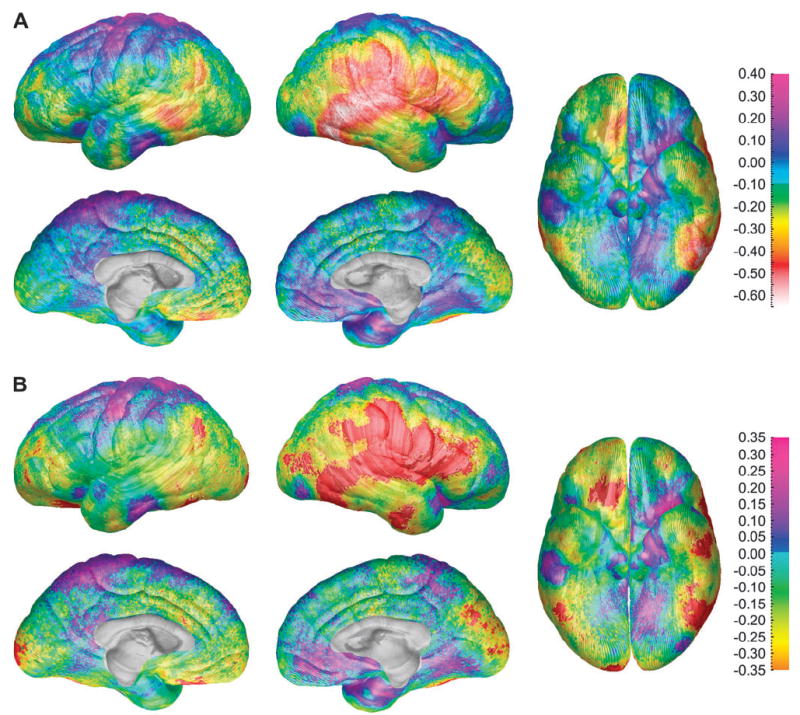
(A) Gray matter thickness sex difference maps for the subgroup of 36 age- and brain volume–matched subjects showing differences in gray matter (in millimeters) between the male and female subjects according to the color bar on the right. Warmer colors (<0 on the color bar) are regions where females have thicker gray matter than the males, and cooler colors (<0) are regions where the males have thicker gray matter than the females. Note the approximately 0.6-mm thicker cortices in females in the right posterior temporal lobe. (B) Statistical differences between the sexes in gray matter thickness for the subgroup of 36 age- and brain volume–matched subjects showing the significance of gray matter thickness differences between the male and female subjects according to the color bar on the right (Pearson’s correlation coefficients ranging from −0.2 to 0.2). Regions overlaid in red correspond to correlation coefficients that show significant increase in gray matter thickness in the female subjects at a threshold of P = 0.05. There were no regions where the male subjects had thicker cortex than the females at a threshold of P = 0.05.