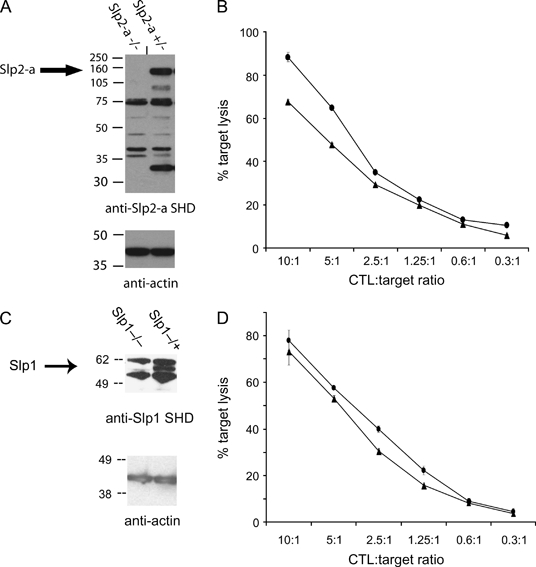
Figure 8. Slp2-a and Slp1-deficient CTL show normal levels of killing.

A) Western blots of CTL lysates probed with anti-Slp2-a SHD or actin antibodies and B) killing assays from Slp2-a −/− (triangles) and +/− (circles) mice. C) Western blots probed with anti-Slp1 SHD or actin antibodies and D) killing assays showing percentage target cell lysis from Slp1 +/− (circles) and Slp1 −/− (triangles). Error bars represent standard deviation from triplicates for each CTL:target ratio. Molecular weight markers shown on the left of Western blots (in kiloDalton) with arrows pointing to the bands corresponding to Slp2-a and Slp1.
