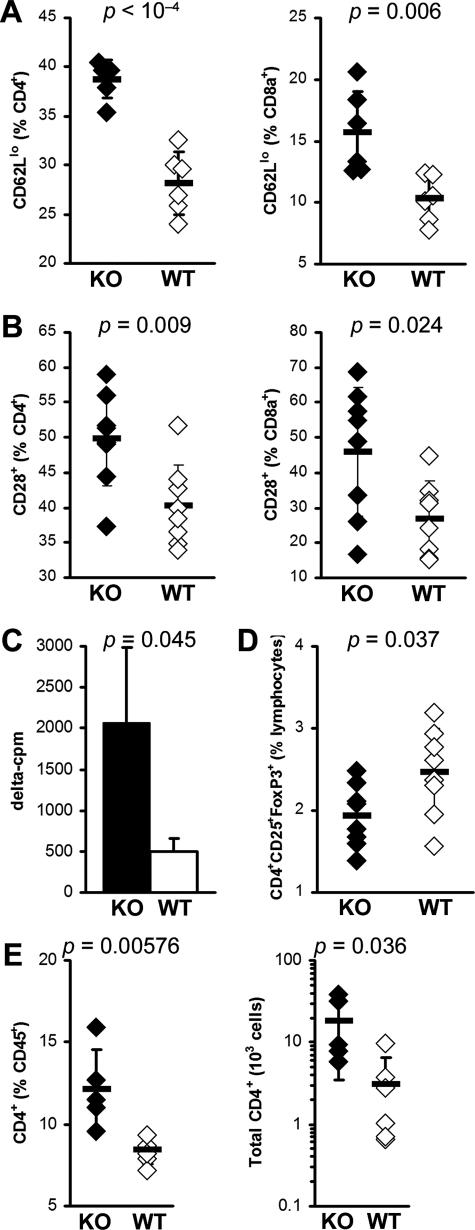
Figure 7.
IL-13 KO mice display greater spleen T-cell activation. A: Activated CD4+ (left) and CD8α+ (right) T cells were determined by surface CD62Llo expression. B: Activated CD4+ (left) and CD8α+ (right) T cells were determined by surface CD28 expression. Data represent percentage of CD4+ or CD8α+-gated cells in individual IL-13 KO (filled diamonds) or WT (open diamonds) animals. Horizontal bars indicate the mean of each group ± the SD. Data are representative of two independent experiments. C: Seventy-two-hour proliferation of spleen cells from IL-13 KO mice (filled bar) is greater than from WT BALB/c mice (open bar) in response to 10 μg/ml of MyHCα614–629 at day 21 after infection, as determined by [3H]Me-thymidine uptake. Data indicate the mean δ cpm (stimulated cpm − unstimulated cpm; values for individual animals are the mean of triplicate wells) for each group (n = 3); plus the SD. D: CD4+CD25+Foxp3+ Treg cells as a proportion of spleen lymphoid cells, in IL-13 KO (filled diamonds) or WT (open diamonds) animals at day 21 after infection. E: Intracardiac CD4+ T cells as a proportion of total CD45+ leukocytes (left) and calculated absolute numbers (right) in IL-13 KO (filled diamonds) or WT (open diamonds) animals at day 21 after infection. Horizontal bars indicate the mean of each group ± the SD. Statistics are by two-tailed Student’s t-test.

