Figure 8.
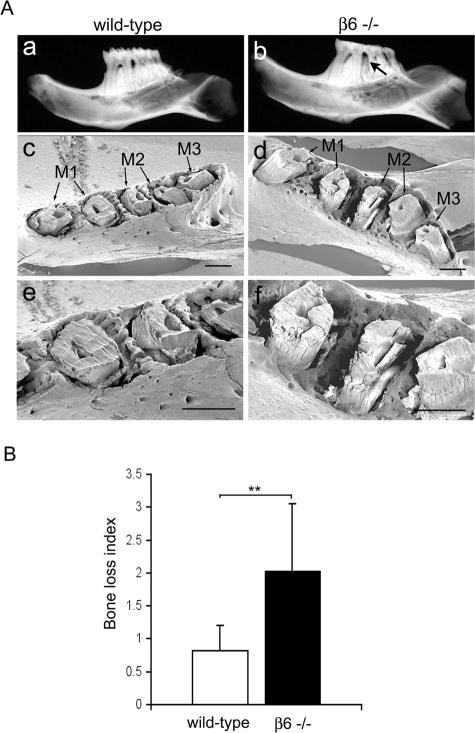
β6 integrin-knockout mice show extensive bone resorption between the teeth. A: Radiographs (a, b) and scanning electron microscopy images (c–f) of WT (a, c, e) and Itgb6−/− (β6−/−; b, d, f) mouse half-mandibles from 12-month-old animals. The arrow in b points to an area of decreased bone density, indicating bone loss. In c and d, an interproximal resorption is noted between the first and second molars. M1, first molar; M2, second molar; M3, third molar. B: Quantitative assessment of the degree of bone loss measured from radiographs. Data presented are mean ± SD from 11 WT and 11 Itgb6−/− half-mandibles, providing 110 sites for measurement. The difference between WT and Itgb6−/− is statistically significant (**P < 0.01; Mann-Whitney U-test). Scale bars = 500 μm.

