Figure 1.
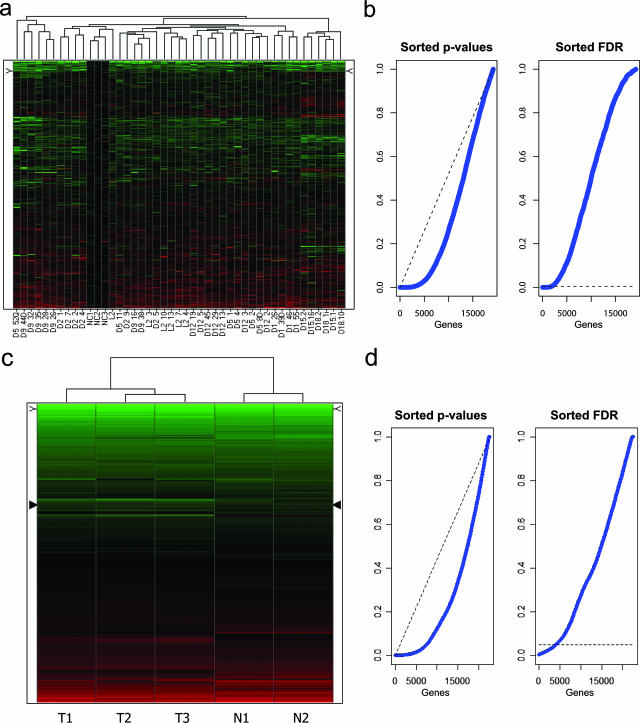
Unsupervised hierarchical cluster analysis of expression profiles from human and mouse intestinal polyps, without preliminary gene selection. Up- and down-regulated probes are depicted in red and green, respectively. a: Unsupervised hierarchical clustering analysis of 42 colorectal adenomatous polyps (obtained from eight unrelated FAP patients with previously identified germline APC mutations23) and 3 control normal mucosa samples (labeled as NC1-3) obtained from individuals with no history of CRC. b: Distribution of P values (left plot) relative to the comparison of patient-derived colorectal adenomas versus normal mucosa samples, sorted in ascending order (blue line). The dashed (black) line represents what would be expected if no effect was detectable. In the right plot, FDR-adjusted sorted P values are shown. The dashed line represents the FDR threshold used in our study to select the differentially expressed genes in the human set that led to the selection of 1859 probes. c: Unsupervised hierarchical clustering analysis of duodenal adenomas (n = 3, labeled T1–T3) and normal mucosa (n = 2, N1–N2) samples obtained from inbred C57BL6/J Apc+/1638N and Apc+/+ mice, respectively. d: Distribution of P values (left plot) relative to the comparison of mouse duodenal adenomas versus normal tissue samples, sorted in ascending order (blue line). The dashed (black) line represents what would be expected if no effect was detectable. In the right plot, FDR-adjusted sorted P values are shown. The dashed line represents the FDR threshold used in our study to select the differentially expressed genes in the mouse set that led to the selection of 4137 probes.

