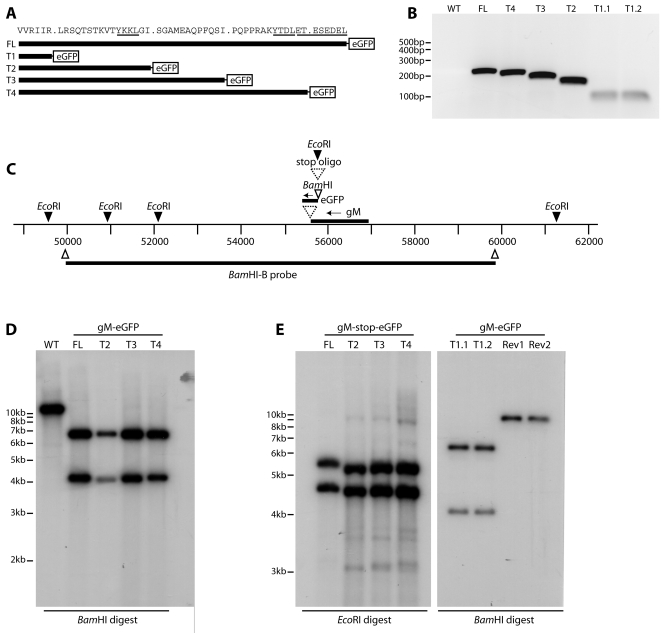
Figure 1. Generation of MuHV-4 gM cytoplasmic tail truncation mutants.
A. The MuHV-4 gM cytoplasmic tail contains 2 YxxΦ motifs and an acidic cluster. Truncation mutants were designed to delete sequentially each motif, as well as a further deletion of the amino acid residues between the 2 YxxΦ motifs. Each gM derivative was tagged with eGFP to allow its visualization in infected cells. B. Because the truncations were too small to be distinguished by Southern blotting, we checked them by PCR, using a 5′ gM primer just upstream of the deletions (genomic co-ordinates 55944–55962) and a 3′ eGFP primer 65 nt from its start of codon. WT = wild-type, which does not amplify because it has no eGFP tag on gM. FL = full-length tagged gM. T1.1 and T1.2 are independent mutants. The correctness of each deletion was confirmed by DNA sequencing its PCR product. C. The MuHV-4 gM locus was modified by inserting a C-terminal eGFP tag. On this scale, the truncations of each mutant are too small to discern. Independent FL T2, T3 and T4 mutants were made with an inserted oligonucleotide terminating translation before the eGFP tag. D. Viral DNA from wild-type MuHV-4 (WT) or eGFP-tagged gM derivatives (FL, T2, T3, T4) was digested with BamHI, electrophoresed, blotted and probed with the Bam-B genomic fragment as shown in C. Inserting the eGFP coding sequence with its 5′ BamHI site converted a 10 kb band to 4.1 kb+6.6 kb (eGFP contributing 0.7 kb). The T1 mutant was not included in this blot because it did not reconstitute infectious virus. E. DNA was recovered from each untagged gM mutant virus. The oligonucleotide separating gM from the eGFP tag has a diagnostic EcoRI restriction site. The viral DNA was digested with EcoRI and probed across the BamHI-B region as before. Oligonucleotide insertion converted a 9.2 kb EcoRI-restricted band to 5.5 kb+4.4 kb. The difference in migration between the FL and T2–T4 viruses reflects a difference in DNA preparation rather than a real difference in size, since slightly slower migration was observed for all the FL bands on ethidium bromide staining (data not shown). The small EcoRI bands at genomic co-ordinates 50,000–52,000 are not visible on this gel. BAC DNA from the T1.1 and T1.2 independent mutants was analyzed at the same time by BamHI digestion and BamHI-B probing. Rev1 and Rev2 are revertant BACs for each mutant.

